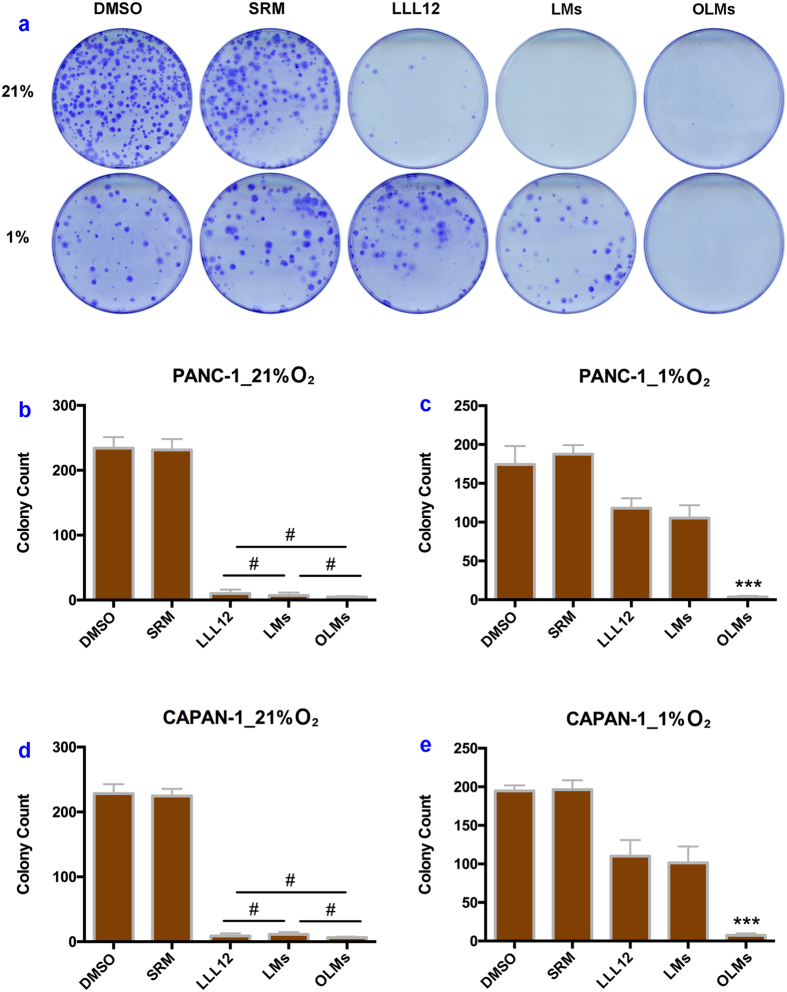
Figure 4.
Cancer cell colony formations after different treatments at normoxic and hypoxic conditions. (a) PANC-1 colony photograph microscopy after treatment two weeks among different groups; (b,c) Analysis comparison of PANC-1 colony numbers counted 2 weeks post treatment in 21% and 1% oxygen, respectively; (d,e) Analysis comparison of CAPAN-1 colony numbers counted 2 weeks post treatment in 21% and 1% oxygen, respectively. #P > 0.05, ***P < 0.001 versus other groups. Error bars in all data represent S.D. (n = 3).

