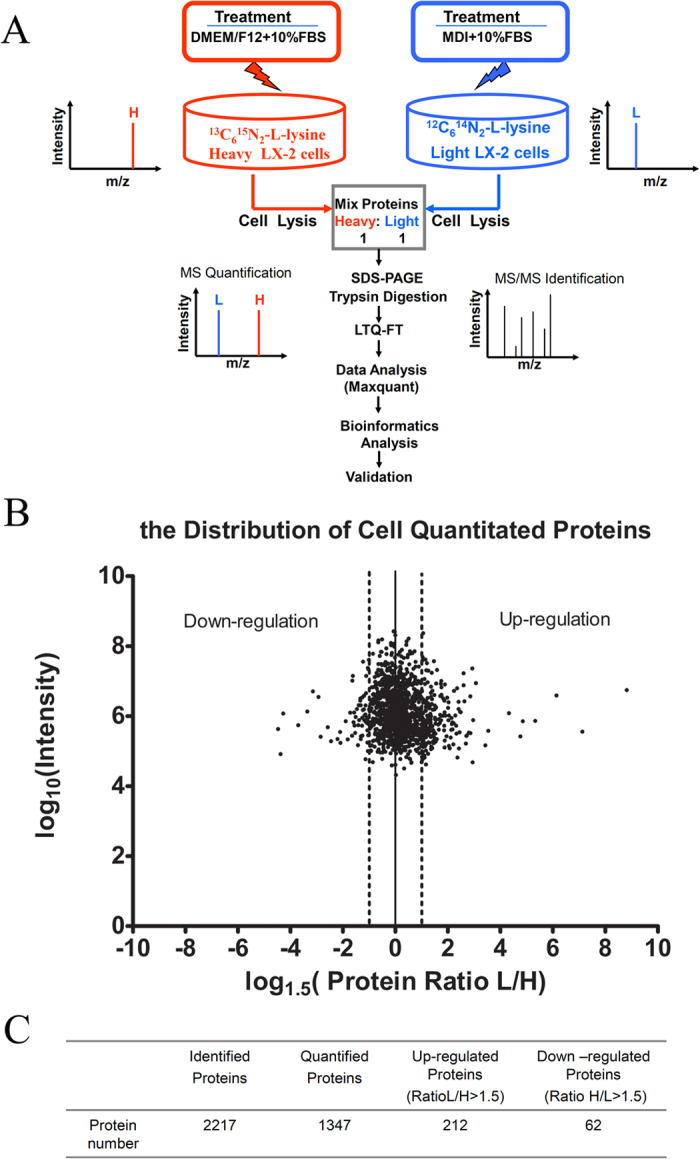
Figure 1. Schematic overview of the study design and summarizing the results.

(A) Schematic overview of the SILAC method combined with LTQ-FT analysis used in this study. (B) The summary of the number of proteins identified and quantified in SILAC experiment and proteins with ratio (L/H) or ratio (H/L) greater than 1.5 were considered as significantly perturbed by MDI. (C) Distribution of protein expression ratios as determined by SILAC (n = 1,347 proteins, mean SILAC ratio = 0.97). Note: SILAC data was analysed by Analyst Maxquant (version 1.1.1.36). L: MDI group, H: Con group.
