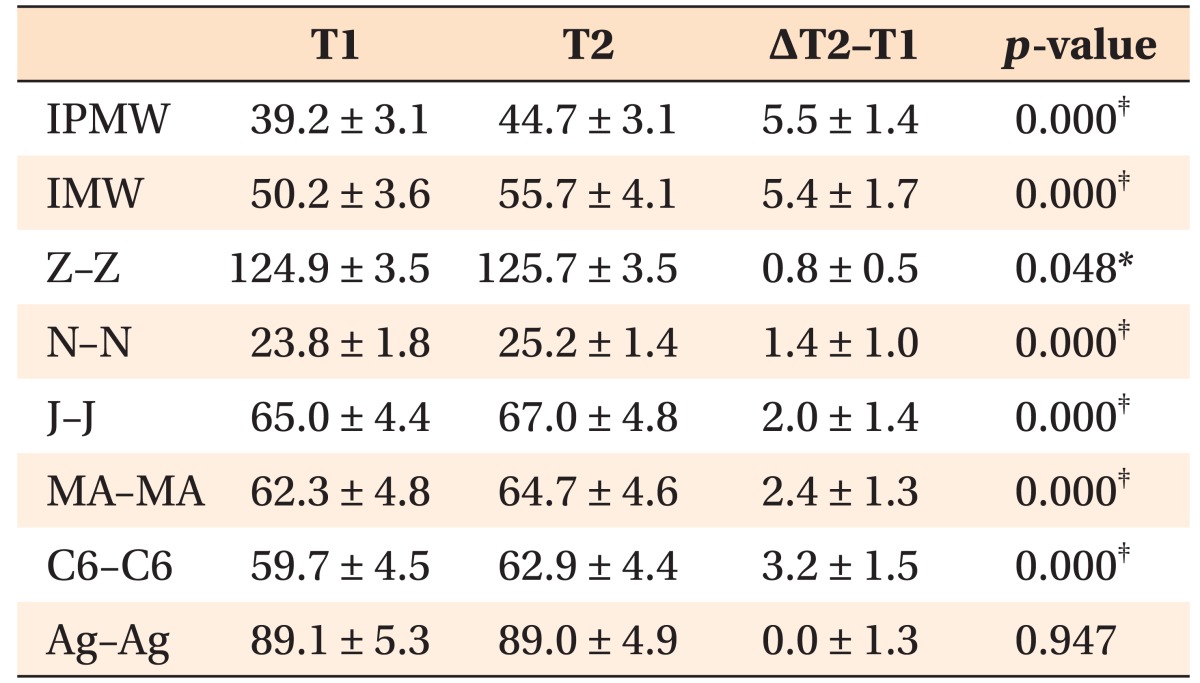
Table 2. Comparison of skeletal and dentoalveolar measurements before (T1) and after (T2) expansion (n = 14; mm).
Data are presented as mean ± standard deviation.
IPMW, Interpremolar width; IMW, intermolar width.
Please refer to Table 1 for the definition of each landmark.
Paired t-tests were performed according to the normality of the data; *p < 0.05, ‡p < 0.001.

