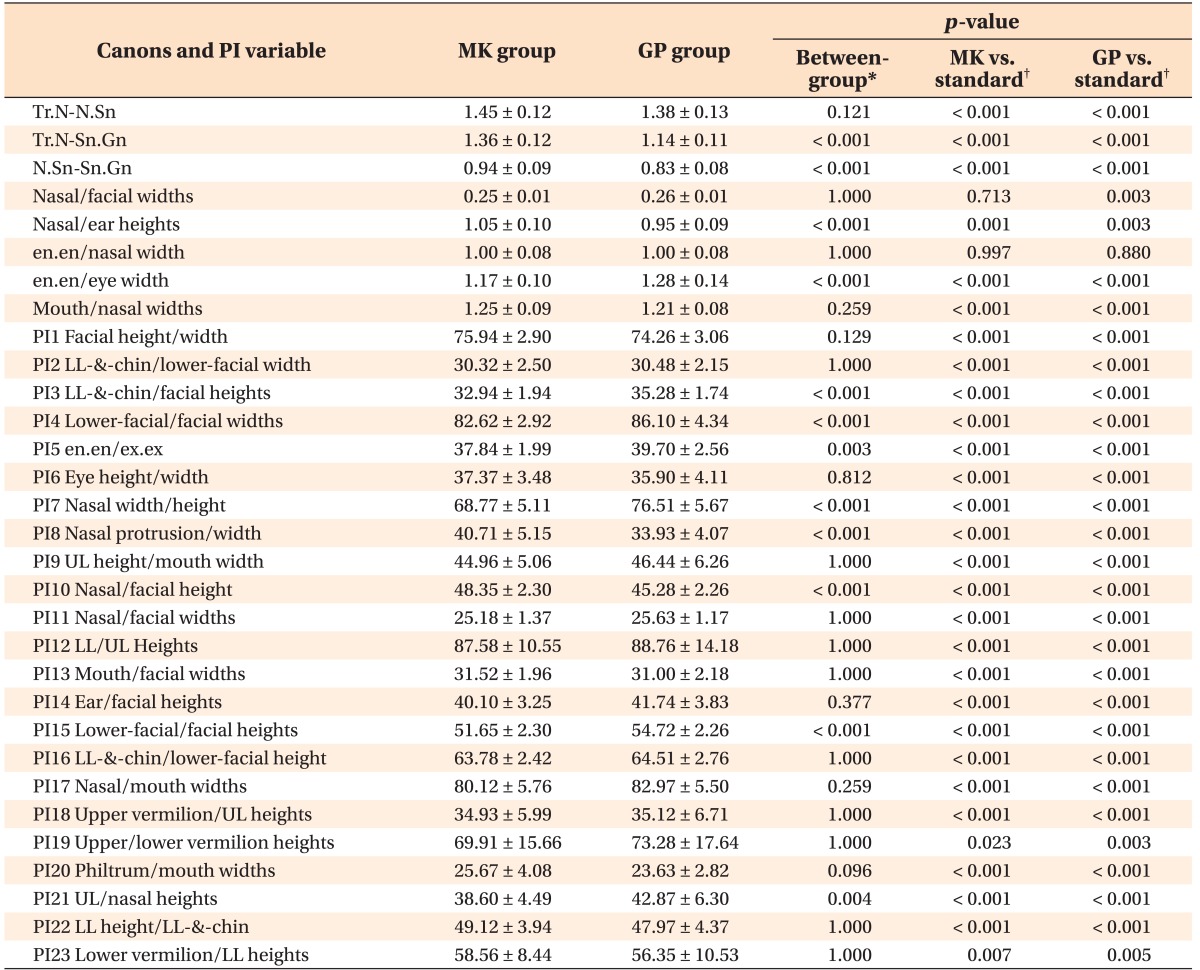
Table 5. Comparison of the canons and proportion index (PI) between the groups.
Values are presented as mean ± standard deviation.
Within each group, values of the canons were compared the neoclassical standards, and values of PIs were compared to the golden ratio.
UL, Upper lip; LL, lower lip, MK, miss Korea; GP, general population.
*Independent t-test, †one-sample t-test; adjusted p-values using the Holm-Bonferroni method for multiple comparisons.

