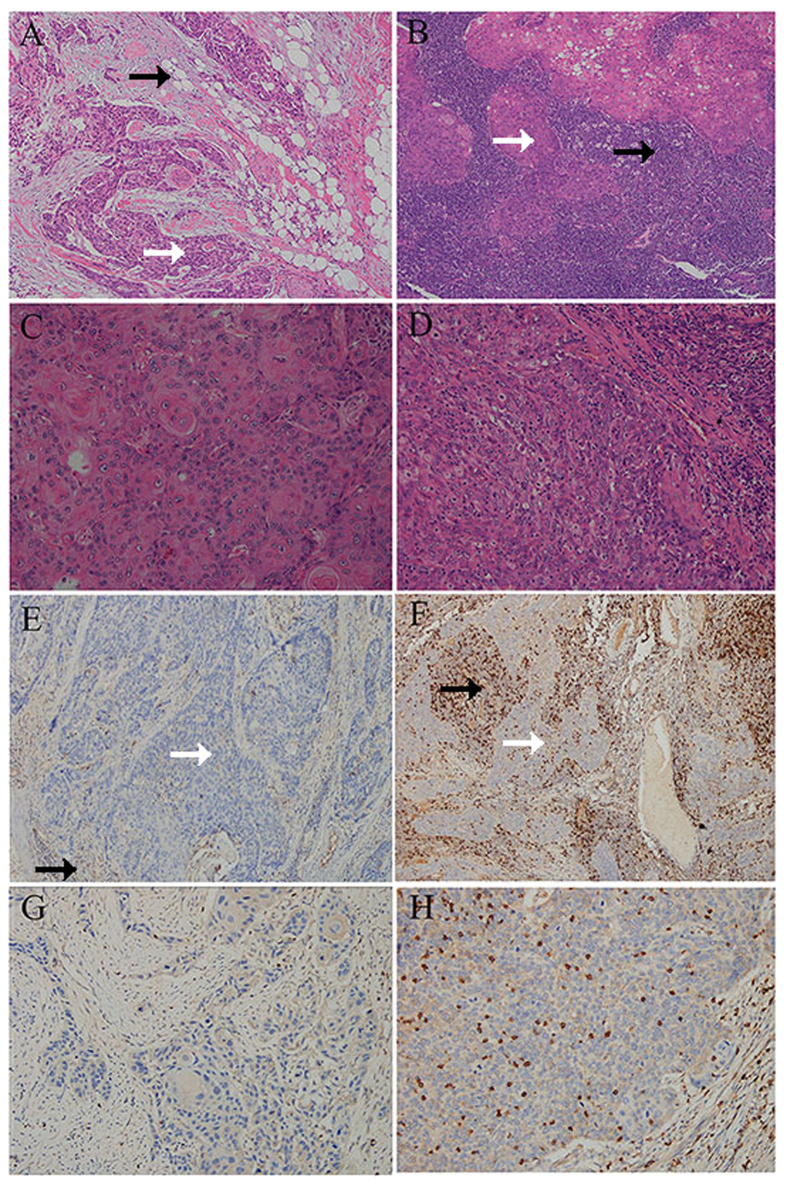
Figure 1. Representative views of tumour infiltrating lymphocytes (TILs) and CD8 expression in ESCC.
Examples of low sTIL (A) and high sTIL (B) in stromal compartments (magnification 10×), low iTIL (C) and high iTIL (D) in intraepithelial compartments (magnification 40×), CD8+ low sTIL (E) and CD8+ high sTIL (F) in stromal compartments (magnification 10×), CD8+ low iTIL (G) and CD8+ high iTIL (H) in intraepithelial compartments (magnification 40×). White and black arrows indicate tumoural and stromal area respectively.

