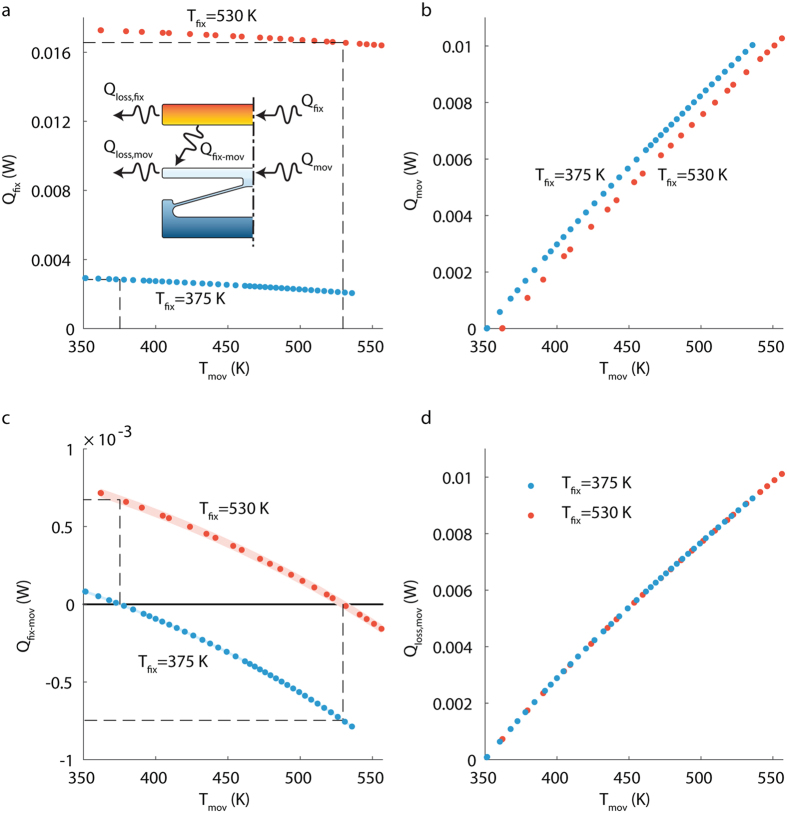
Figure 5. Measurement of heat transfer rate across terminals.
(a) Measured heat dissipated in the fixed terminal (Qfix) versus temperature of the moving terminal (Tmov). Each set of Qfix and all other related measurements were conducted while the fixed terminal temperature (Tfix) was kept at a constant value. The two data sets correspond to two temperature values for Tfix: 375 and 530 K. (b) Measured heat dissipated in the moving terminal (Qmov) versus Tmov, for two different Tfix values of 375 and 530 K. Uncertainties were not plotted in a and b since they were low, less than 0.16% and 0.29% for Qfix and Qmov, respectively. (c) heat transfer from the fixed to the moving terminal (Qfix-mov) versus Tmov for the two different Tfix values. The dashed lines illustrate the heat transfer across terminals in forward and reverse directions for the set of temperature of 375 and 530 K. Uncertainties in the heat transfer rates are represented by the shaded area around the data points, with a maximum value of 2.74 × 10⁻⁵ W. (d) Heat losses from the moving terminal (Qloss,mov) versus Tmov, for the two different Tfix values. Uncertainties were not plotted here as they were low, less than 3.89 × 10⁻⁵ W. Uncertainty was calculated based on the technique reported in ref. 36, more details in Supplementary Information.

