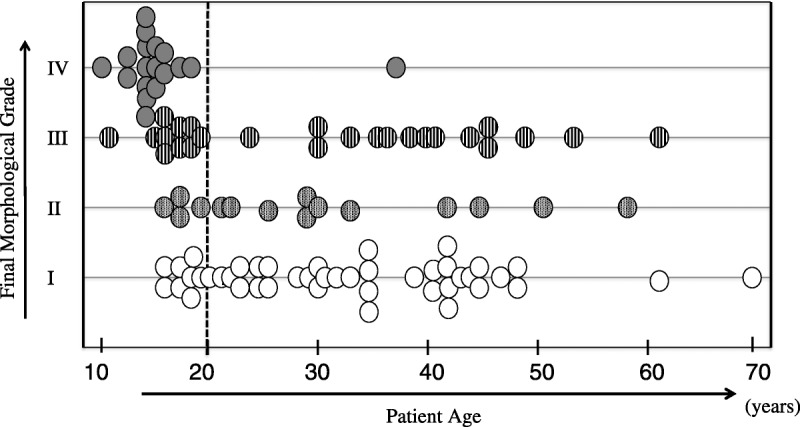
FIGURE 6.

Scatter diagram of final grade and patient age. Of patients less than 20 years of age, the final MRI revealed that 69.2% were in the grade III + IV group. There was a significant difference in the frequency of grade III + IV between age groups (age <20 vs. ≥20 years; P < 0.0001).
