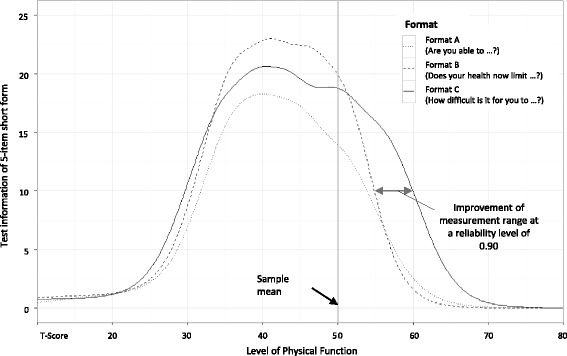
Fig. 2.

Comparison of test information functions between different item formats. Format A: “Are you able to …” (five-category response scale from “Without any difficulty” to “Unable to do”); format B: “Does your health now limit you in …” (five-category response scale from “Not at all” to “Cannot do”); format C: “How difficult is it for you to …” (six-category response scale from “Very easy” to “Impossible”). Item parameters and information functions were initially estimated using a standard normal physical function (PF) metric. PF values were subsequently transformed to a T-metric, where 50 = mean and 10 = standard deviations of the analytic sample (x-axis). Test information values on the y-axis are reported unchanged
