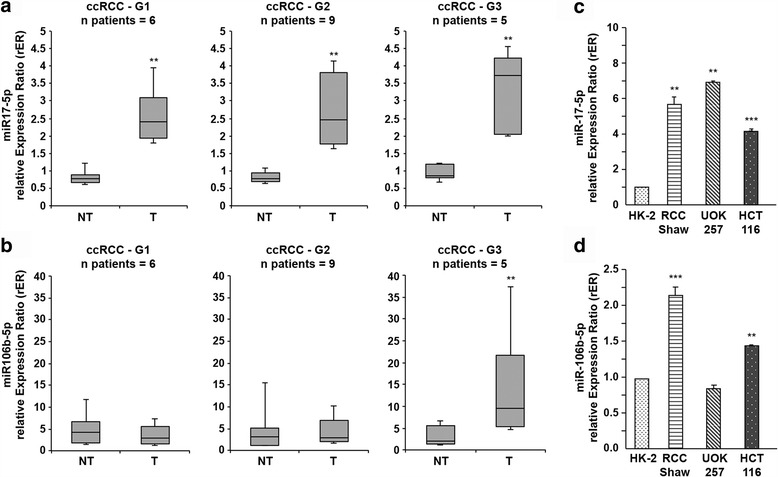
Fig. 1.

miR-17-5p and miR-106b-5p expression in ccRCC samples. a, b miR-17-5p and miR-106b-5p expression in ccRCC samples and their paired non-tumour tissues. The analysis was performed considering the Fuhrman grading of the tumour samples. Data are represented in box-and-whisker plots showing median and 10th, 25th, 75th and 90th percentiles for each category of sample. Expression data were measured respect to one normal sample chosen arbitrarily as calibrator and then normalized by the expression levels of U6 snRNA. **p-value < 0.005. c, d miR-17-5p and miR-106b-5p expression in the colon cancer HCT116 (p53wt) cell line and in three different renal cell lines: the human proximal tubular epithelial cells HK-2, the human renal cell carcinoma RCC-Shaw (p53wt) and the human renal carcinoma of BHD (Birt-Hogg-Dubè) origin UOK-257 cells (mutated-p53). Expression data were measured respect to HK-2 sample chosen as calibrator, and normalized by the expression levels of U6 snRNA. **p-value < 0.005; *** p-value < 0.001
