
Fig. 1.
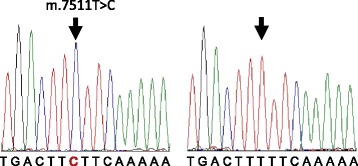
Electropherograms of part of the MTTS1 sequence. Sequence from the proband (III-5, left; showing the m.7511T > C mutation) and a control subject with normal hearing (right) are shown
Official websites use .gov
A
.gov website belongs to an official
government organization in the United States.
Secure .gov websites use HTTPS
A lock (
) or https:// means you've safely
connected to the .gov website. Share sensitive
information only on official, secure websites.
Electropherograms of part of the MTTS1 sequence. Sequence from the proband (III-5, left; showing the m.7511T > C mutation) and a control subject with normal hearing (right) are shown