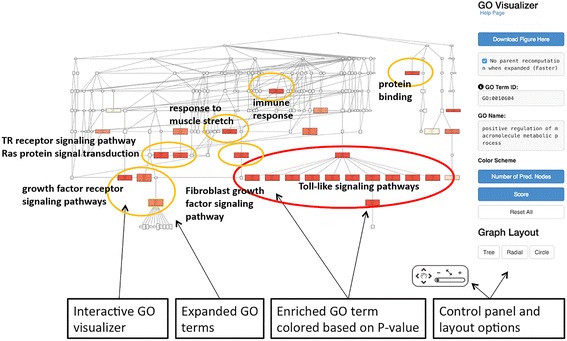
Fig. 6.

Visualization for enrichment analysis. The top 30 enriched GO terms from MAPK pathway proteins visualized in the GO hierarchy. Enriched GO terms are enlarged and colored by their p-value. The analysis is for 20 annotated proteins that are associated with MAPK signalling pathway. See text for the details
