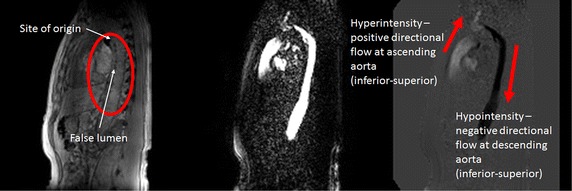
Fig. 4.

Phase contrast measurement of blood flow in aorta. (Left) Structural T1 imaging of a dissected aorta; (middle) magnitude image of spin echo signal in phase contrast MRI; (right) phase image in phase contrast MRI. The images are captured in sagittal view with inferior-superior direction velocity encoding. In structural image the artery can clearly identified with two separated compartments. The velocity can also encode in anterior-posterior and left–right direction to generate orthogonal velocity vector components. This can be used to demonstrate 3 + 1D flow patterns and indicating the presence of complex flow along the channels of the artery. The reconstructed flow field could also applied as a boundary condition and validation of computerized flow simulations
