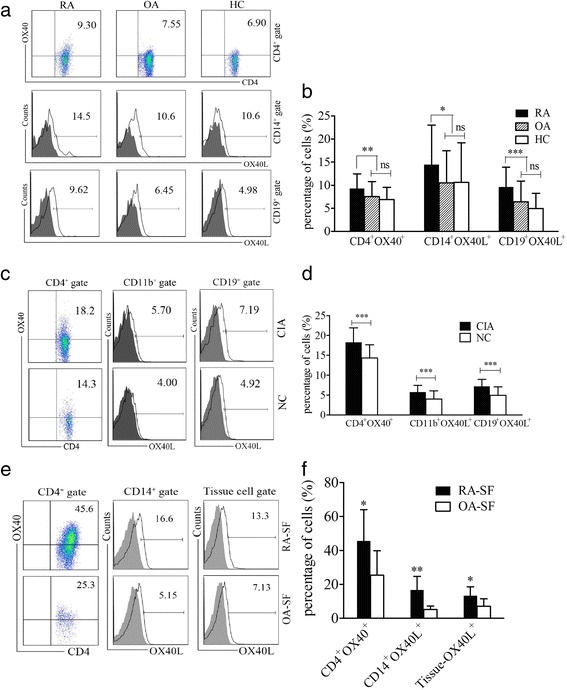
Fig. 1.

Expression of OX40 and its ligand OX40L in patients with RA and CIA mice. a, c, e Flow cytometry detection of OX40 and OX40L expression on immune cells in (a) PB or (e) SF samples of patients with RA, patients with OA, and HCs or (c) the spleen samples of CIA and NC mice. Data indicate the mean (%) of OX40+ or OX40L+ cells among gated cells. Solid lines indicate specific staining of OX40L, and gray shading represents isotype controls (scatter diagrams of isotype controls are not shown). b Percentages of CD4+OX40+, CD14+OX40L+, and CD19+OX40L+ cells in the PB samples of patients with RA (n = 71), patients with OA (n = 44), and HCs (n = 47). d Percentages of CD4+OX40+, CD11b+OX40L+, and CD19+OX40L+ cells in the spleen samples of CIA (n = 40) and NC (n = 30) mice. f Percentages of CD4+OX40+, CD14+OX40L+ and tissue OX40L+ cells in the SF samples of patients with RA (n = 10) and patients with OA (n = 10). Bars indicate mean ± SD; * P < 0.05, ** P < 0.01, *** P < 0.001, ns = not significant. CIA Collagen-induced arthritis, HC Healthy control subject, NC Normal control mice, OA Osteoarthritis, PB Peripheral blood, RA Rheumatoid arthritis, SF Synovial fluid
