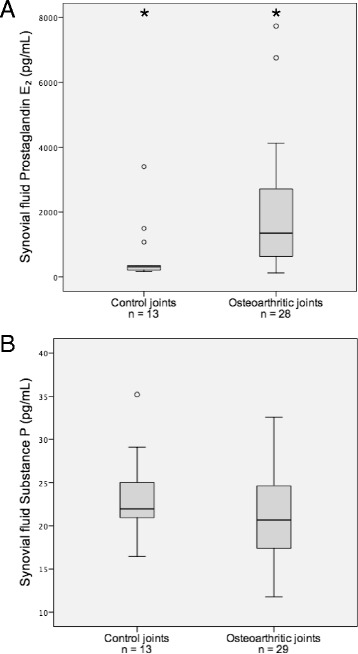
Fig. 2.

Synovial fluid PGE2 (a) and SP (b) concentrations in osteoarthritic and control joints. The central horizontal line indicates the median value and the boxes indicate the IQR. The top and bottom whiskers represent the highest and lowest case within 1.5 times of IQR, respectively. Values more than 1.5 times IQR are labelled outliers and represented as dots. *Values differ significantly (P = 0.001)
