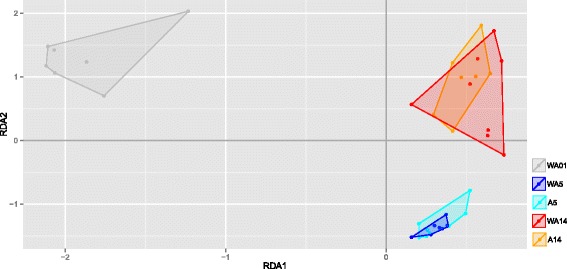
Fig. 3.

Redundancy analysis (RDA) of family level microbial groupsThe x-axis depicts explanatory axis 1 (RDA1) and y-axis depicts explanatory axis 2 (RDA2). Each condition is represented by a different colour (day 1, grey; day 5, where ‘WA’ is blue and ‘A’ is cyan; and day 14 where ‘WA’ is red and ‘A’ is orange). In total there are 5 treatment-day combinations consisting of up to 8 points, where each point represents 1 pool consisting of 10 chicken. The grey arrows represent the environmental variables as constraining variables (i.e. the different microbial groups). In total there are 5 treatment-day combinations consisting of up to 8 points (pools), where each point represents 1 pool consisting of 10 chicken. The following model was used as input for the RDA: y = Time + Treatment + Time* Treatment + error. Abbreviations: WA1, without antibiotic day 1; WA5, without antibiotic day 5; A5, with antibiotic day 5; WA14, without antibiotic day 14; A14, with antibiotic day 14
