Fig. 3.

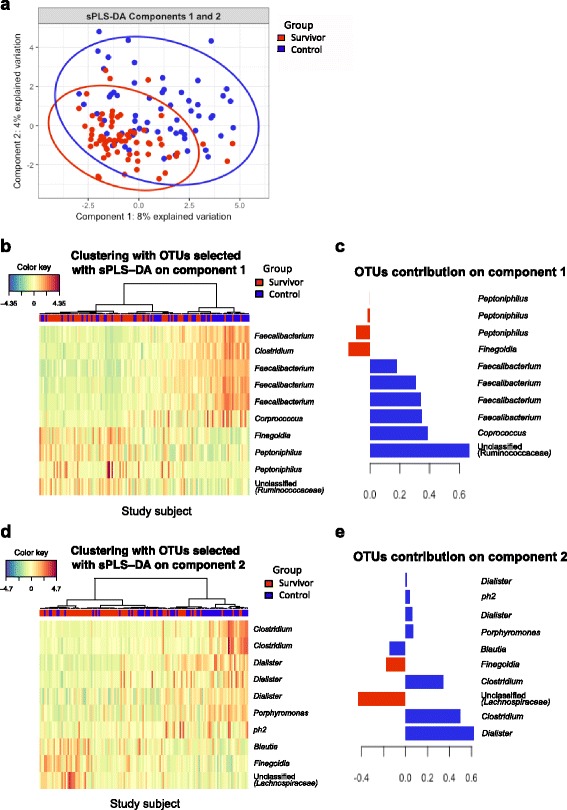
Identification of groups (survivors or controls) associated with OTUs using CLR transformation and sPLS-DA model. Individual samples were presented on a PCA plot based on the selected OTUs and are distinguished by group with color and 95% confidence eclipses (a). The abundance of each selected OTUs are presented on clustering heatmaps (b, d). The contribution of the OTUs that associated to each group on the first and second components are presented with contribution plots (c, e)
