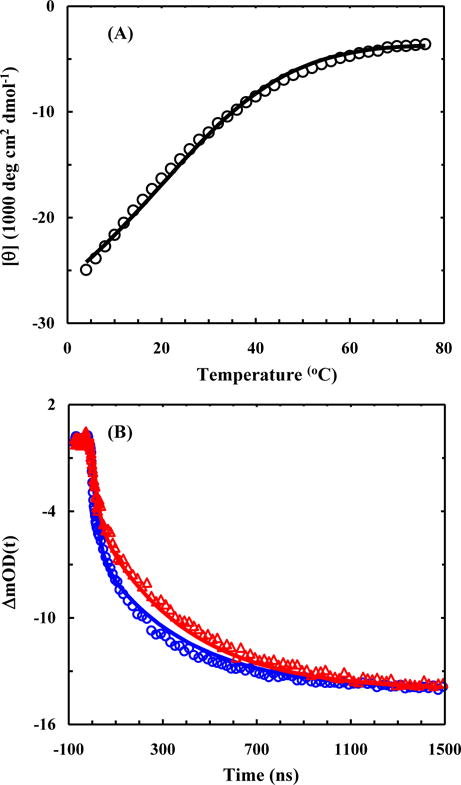
Figure 3.

Global fitting results of the CD thermal unfolding curve (A) and the IR T-jump relaxation kinetics (B) of the AK peptide using 9 rate constants. In each case, the symbols represent the original experimental data and the line corresponds to the respective fit.
