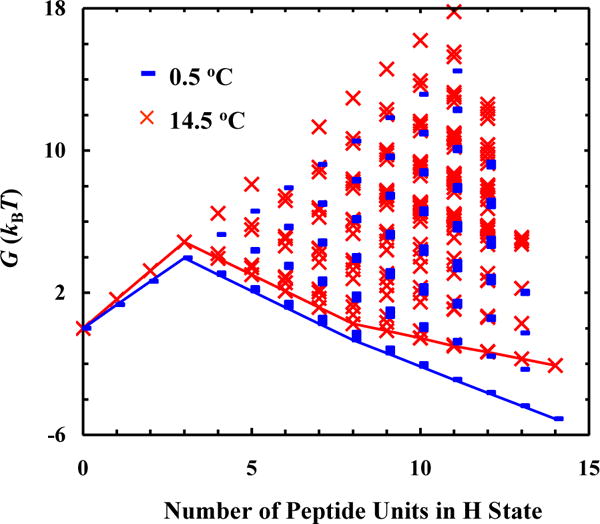
Figure 5.

Free energy (G) of the AK peptide as a function of its conformation (i.e., the number of peptide units in H state) at 0.5 and 14.5 °C, as indicated. In each case, the line represents the minimum free energy surface. Each data point represents the free energy of a possible conformational state, calculated based on the definition in Scheme 2.
