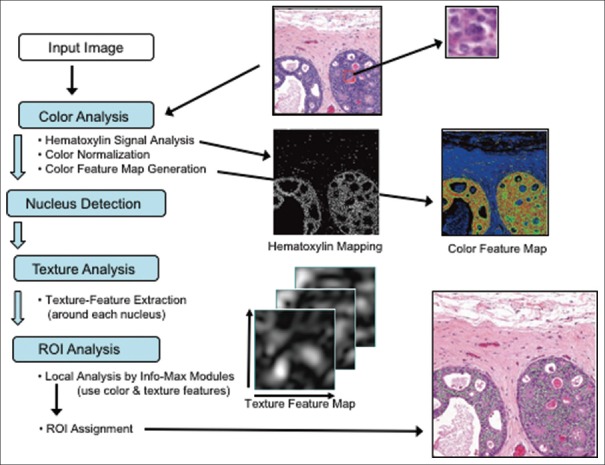
Figure 3.
Outline of the processing flow of the Info-Max algorithm. Through color analysis, a hematoxylin map (middle row, left image) is generated and each nucleus is located. A color feature map (middle row, right image) is also computed from color analysis. A subimage (upper right image) is extracted around each nucleus and is tested to detect whether it contains malignancy characteristics. Texture feature maps (lower left image) and color feature maps are used for the decision. Postprocessing is performed to determine regions of interests (indicated in green in the lower right image)

