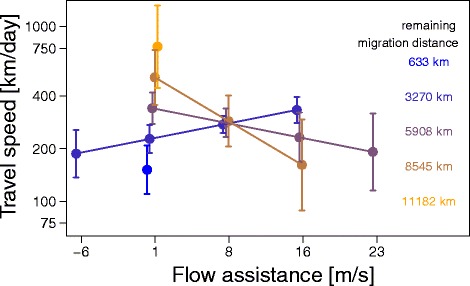
Fig. 5.

Model predictions on the effect of flow assistance by remaining migration distance on travel speed during 153 travel days in spring. To visualize the effect of the two-way interaction between flow assistance and remaining migration distance on the travel speed for each travel day during spring migration as predicted by the model (Table 3), explanatory variables were each summarized into five categories. Within each flow assistance category, values were slightly shifted along the x-axis to avoid overlapping. Given are the mean effects with the 95% CI. The y-axis shows the estimated mean travel speed for the different categories. Different colours indicate different remaining migration categories. Consider that the migration distance tracked during spring differed between individuals, because birds’ locations were not determinable when they were exposed to 24 h of daylight, cf. Fig. 1 and Additional file 5. Last location estimates were still 650 to 6,000 km, with a mean value of 3,400 km, away from the breeding area. Model predictions are only shown for flow assistance actually experienced by the wheatears in the wild
