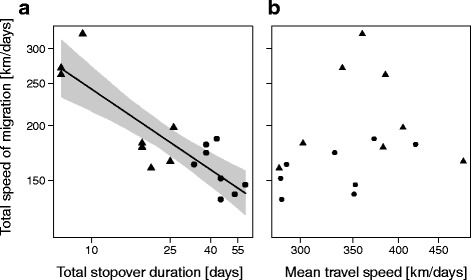
Fig. 6.

Relationship between total speed of migration and (a) total stopover duration, (b) mean travel speed. In (a), the black line is used to visualize the significant relationship between the total speed of migration and total stopover duration, with the corresponding 95% CrI in grey. b The total speed of migration was not significantly affected by the mean travel speed. All axes are on a log10-scale. Spring (triangles) and autumn (dots) data were pooled (see Results). Notably, the tracking towards Alaska in spring ceased when birds experienced 24 h of daylight. Total speed of migration and mean travel speed were therefore only calculated by departure date from the wintering ground to arrival date at the last location estimate during spring migration, cf. Fig. 1. Here we assume that the overall mechanism shaping total speed of migration is unlikely to change in its nature along the migration route. If so, pooling the autumn and the incomplete spring data should not influence how total stopover duration affects total speed of migration
