
Fig. 3.
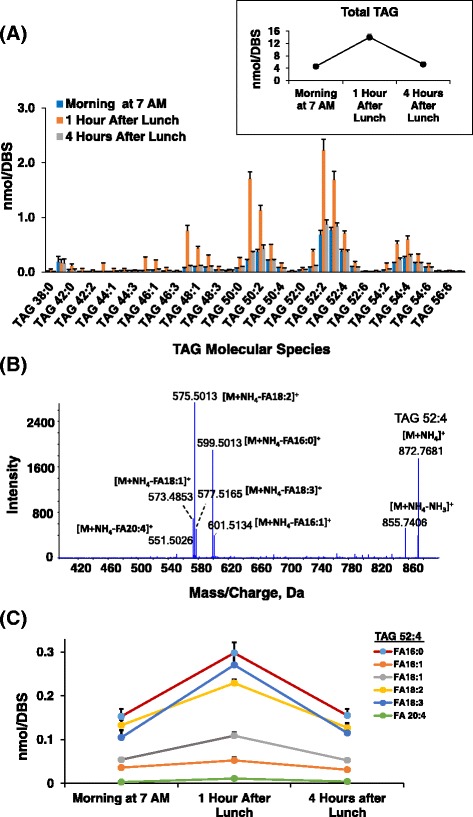
Postprandial triacylglyceride (TAG) profile using blood spots (DBS)-MS/MSALL Lipidomics. (a) Postprandial profile of TAG molecular species (insert: total TAG levels); (b) Identification of TAG 52:4 based on MS/MS fragmentation spectrum; (c) Temporal changes of TAG 52:4 with fatty acid components