
Fig. 5.
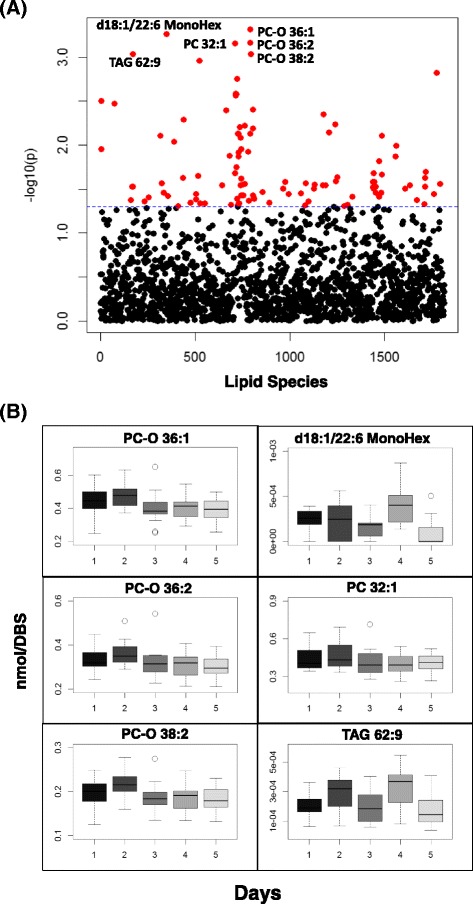
Temporal fluctuation of lipid species over days. (a) The scatter plot of negative log10 (p) vs the lipid species, generated by the repeated one way ANOVA analysis (subject = 16, 5 days); (b) The profiles of the molecular species with the lowest p values over time. The DBS samples were collected in the 5 successive morning after overnight fasting. MonoHex monohexose, PC phosphatidylcholine, TAG triacylglyceride