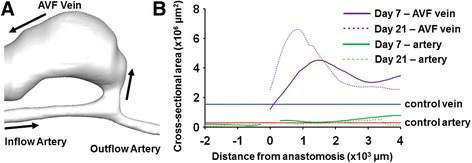
Fig. 3.

Cross-sectional area of mouse AVF vessels. (a) The 3D reconstruction of a representative mouse AVF. Black arrows indicate the direction of blood flow. (b) The anastomosis is used as the anatomical landmark and set to be 0. The positive direction is toward the heart, and the negative direction is away from the heart. The blue line is the average area of control veins (i.e., pre-surgery and contralateral non-surgery veins): 1.55 ± 0.42×106 μm2. The red line is the average area of control arteries (i.e., pre-surgery and contralateral non-surgery arteries): 0.29 ± 0.05×106 μm2
