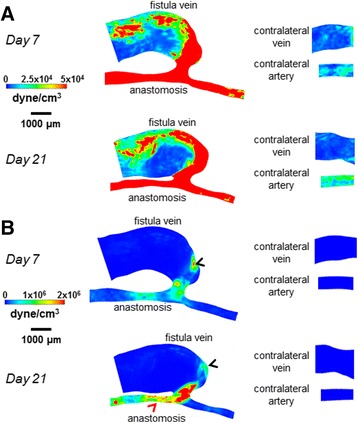
Fig. 6.

Spatial WSSg color maps for the AVF and contralateral non-surgery controls. The color bars are adjusted to emphasize the WSSg distributions in the vein (a) and artery (b). The WSSg was averaged over a cardiac cycle. Peak WSSg in the AVF vein (black arrow heads) and in the inflow artery (red arrow head) was approximately 2×10⁶ dyne/cm3
