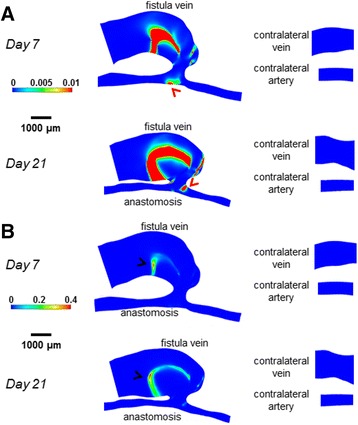
Fig. 7.

OSI color maps for the AVF and contralateral non-surgery controls. The color bars are adjusted to emphasize the OSI distributions in the vein (a) and artery (b). Peak OSI in the AVF vein (black arrow heads) was approximately 0.4, while peak OSI in the inflow artery (red arrow head) was approximately 0.01
