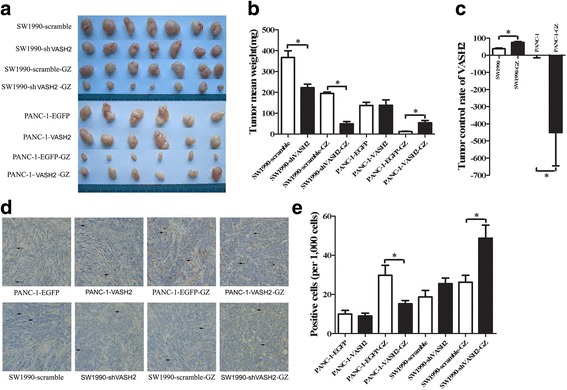
Fig. 3.

Tumor control rate analysis using subcutaneous tumorigenesis in nude mice. Mice were divided into four groups: PANC-1 group (n = 6), mice implanted with PANC-1-EGFP/PANC-1-VASH2 tumor pieces without gemcitabine chemotherapy; PANC-1-GZ group (n = 6), mice implanted with PANC-1-EGFP/PANC-1-VASH2 tumor pieces with gemcitabine chemotherapy; SW1990 group (n = 7), mice implanted with SW1990-scramble/SW1990-shVASH2 without gemcitabine chemotherapy; SW1990-GZ group (n = 7), mice implanted with SW1990-scramble/SW1990-shVASH2 with gemcitabine chemotherapy. a resected xenograft tumors from all groups. b tumor mean weight analysis. c the tumor control rate of VASH2. d and e representative images of and quantitation of TUNEL staining for apoptosis in the xenograft tumors, as determined by counting 1,000 cells in 6 randomly selected fields. The black arrows show the brown stained TUNEL-positive cells. *P < 0.05
