Fig. 5.

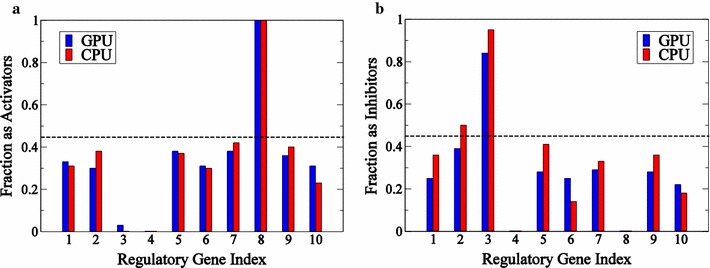
Histograms of activators and inhibitors for gene #4. Value of fractions that each gene appears as an activator (a) or an inhibitor (b) in the ensemble of subnetworks generated for time course illustrated in Fig. 4

Histograms of activators and inhibitors for gene #4. Value of fractions that each gene appears as an activator (a) or an inhibitor (b) in the ensemble of subnetworks generated for time course illustrated in Fig. 4