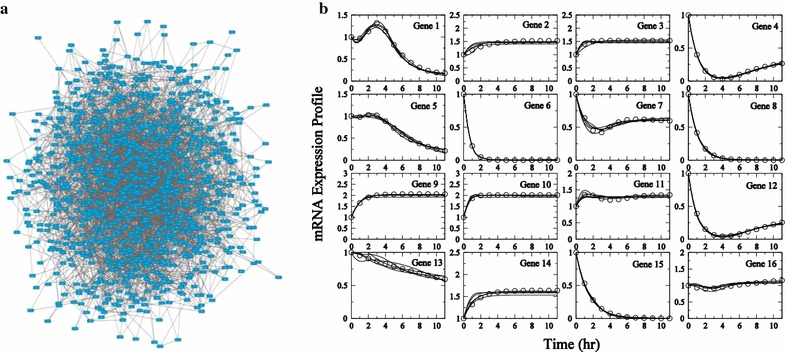
Fig. 7.

Description of the 1000-node network. Network representation of the 1000 node in silico network is presented in a. mRNA expression profiles for the first 16 genes for Experiment 1 are presented in b. In silico data are plotted as circles. Subnetwork model fits to data are plotted as solid lines. Visualization of the network uses Cytoscape [38]
