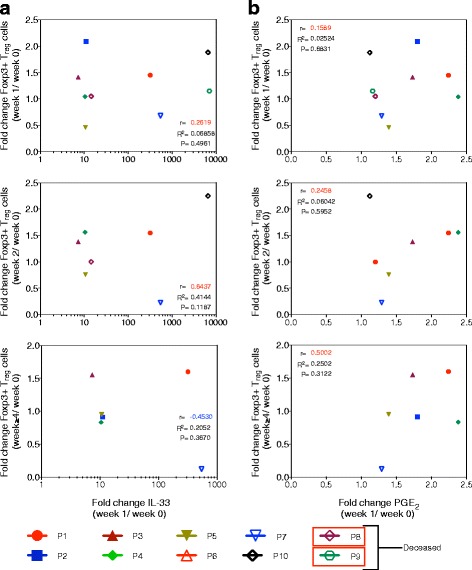
Fig. 2.

Correlation between changes in plasma IL-33 and PGE2 and IVIG-mediated circulating Treg cell expansion in GBS patients. a Correlation between the fold changes in circulating Treg cells at different time points (weeks 1, 2, and ≥4) after initiation of IVIG therapy and the fold changes in plasma IL-33 level at week 1. b Correlation between the fold changes in circulating Treg cells at different time points (weeks 1, 2, and ≥4) after initiation of IVIG therapy and the fold changes in plasma PGE2 level at week 1. Each symbol represents individual patient. r = Pearson correlation. p = statistical significance
