Fig. 1.

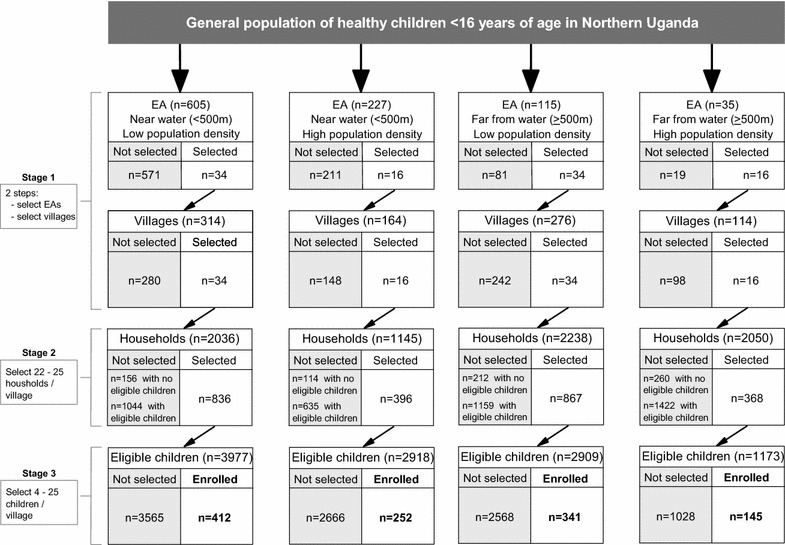
Flow chart showing the sampling of healthy children aged 0–15 years from 100 villages in north-central and northwest regions of Uganda between January 2011 and April 2015

Flow chart showing the sampling of healthy children aged 0–15 years from 100 villages in north-central and northwest regions of Uganda between January 2011 and April 2015