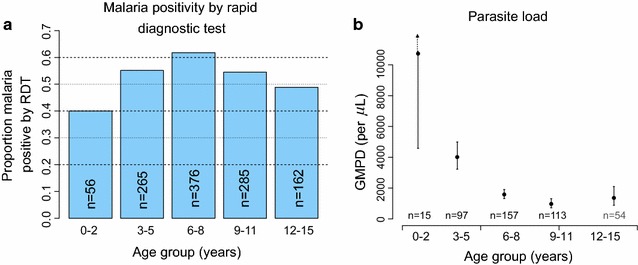
Fig. 4.

Bar graphs showing age-group patterns of weighted per cent Plasmodium falciparum parasite prevalence. Based on the RDT (a) and the GMPD/µL (b) among apparently healthy, microscopy-positive children enrolled between January 2011 and April 2015 from north-central and northwest Uganda. The unweighted number of participants in each age-group is shown. In b, the solid circle indicates the GMPD, the lines indicate the 95% CIs of the GMPD, except for the under 2 years old age group, where the upper boundary is beyond the plotted points. GMPD results were available on 436 of 441 microscopy positive subjects (see Table 2)
