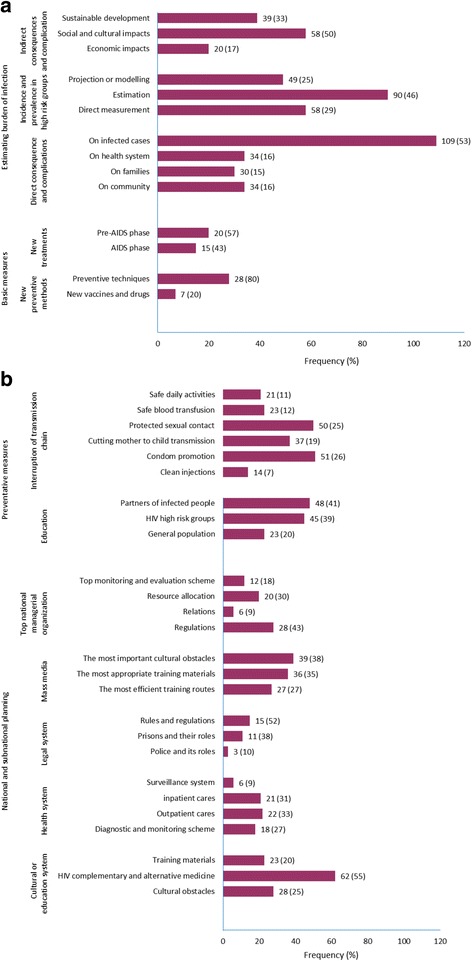
Fig. 4.

a Frequency and percentage (%) of retrieved studies in the categories of basic measures and estimating the burden of infection. The denominator used to calculate the percentages was n = 1280 studies. Bars represent frequency of studies retrieved per category. Figures on the bar graphs indicate frequency and percentage (%). b Frequency and percentage (%) of retrieved studies in the categories of national planning and preventative measures. The denominator used to calculate the percentages was n = 1280 studies. Bars represent frequency of studies retrieved per category. Figures on the bar graphs indicate frequency and percentage (%)
