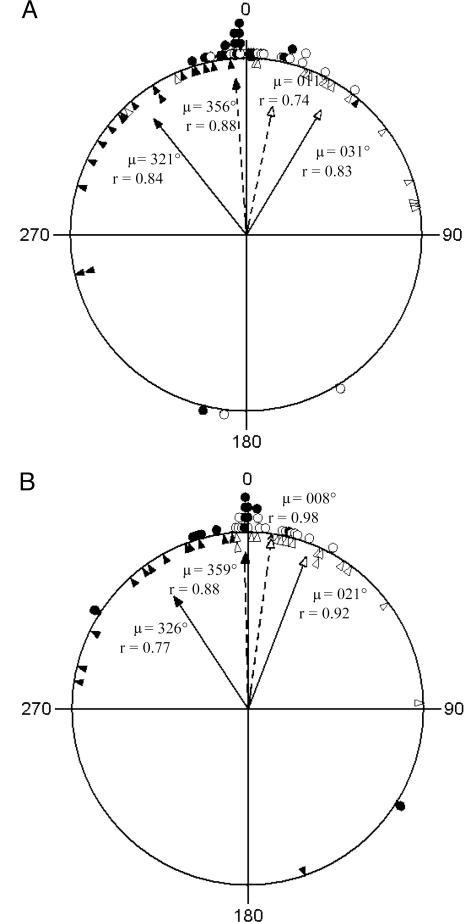
Fig. 2.
Circular diagrams showing changes in flight trajectory upon birds' first contact with their established routes during off-route test releases at Weston Wood (A) and High Cogges (B). Triangles indicate angular deviations in individual off-route trajectories before and after initial contact with the same bird's established route (open triangles correspond to tracks for which birds approached their established routes from the right, and filled triangles correspond to tracks for which they approached them from the left). Circles indicate angular differences between the established route and the off-route trajectory after initial contact (open and filled circles are distinguished as above according to direction of approach). Arrows show mean vectors for angular deviations in precontact versus postcontact off-route trajectories (solid arrows) and postcontact off-route versus established route trajectories (dashed arrows); filled arrowheads denote left approach and open arrowheads denote right approach. See text for further detail.

