
Fig. 3. Concentration-response-curve of 6A7DA-FS on AC 2 in presence of Mg2+.
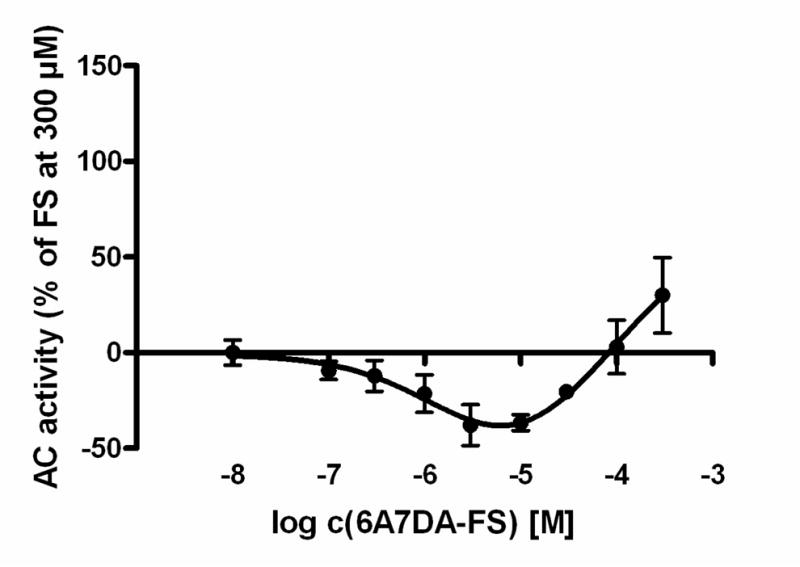
After a 10 min incubation period at 30°C, AC activity was determined as described in “Materials and Methods” for increasing concentrations of 6A7DA-FS (100 nM – 300 μM). Data shown are a combination of 3 independent representative experiments. AC activity was normalized in relation to maximum stimulation obtained by 300 μM FS.