
Fig. 6. Correlation of the docking profiles of diterpenes for mAC isoform models compared to each other.
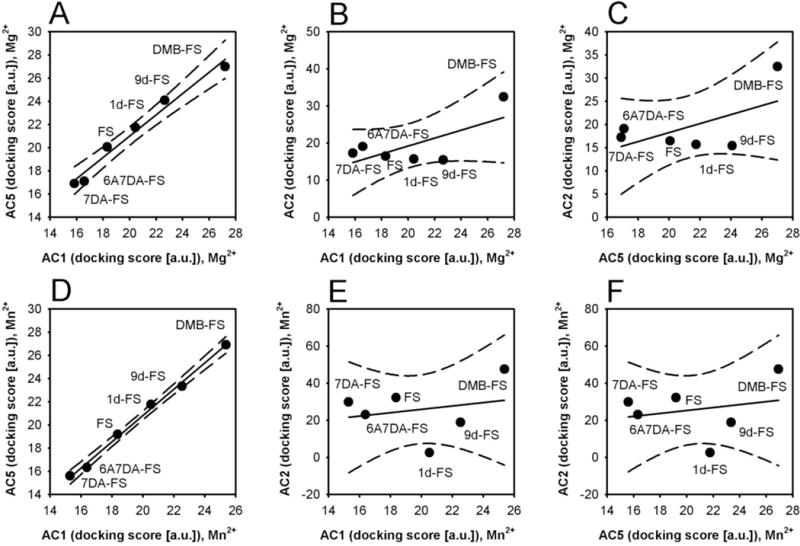
A, correlation of AC1 vs. AC5 in presence of Mg2+ (r2 = 0.97; slope = 0.92 ± 0.07). B, correlation of AC2 vs. AC1 in the presence of Mg2+ (r2 = 0.49; slope = 1.07 ± 0.6). C, correlation of AC2 vs. AC5 in presence of Mg2+ (r2 = 0.35; slope = 0.97± 0.7). D, correlation of AC1 vs. AC5 in the presence of Mn2+ (r2 = 0.99; slope = 1.13 ± 0.04). E, correlation of AC2 vs. AC1 in the presence of Mn2+ (r2 = 0.06; slope = 0.93 ± 1.9). F, correlation of AC2 vs. AC5 in the presence of Mn2+ (r2 = 0.05; slope = 0.79 ± 1.6). Comparisons were analyzed by linear regression; the dashed lines indicate 95% confidence intervals. a.u.; arbitrary unit.