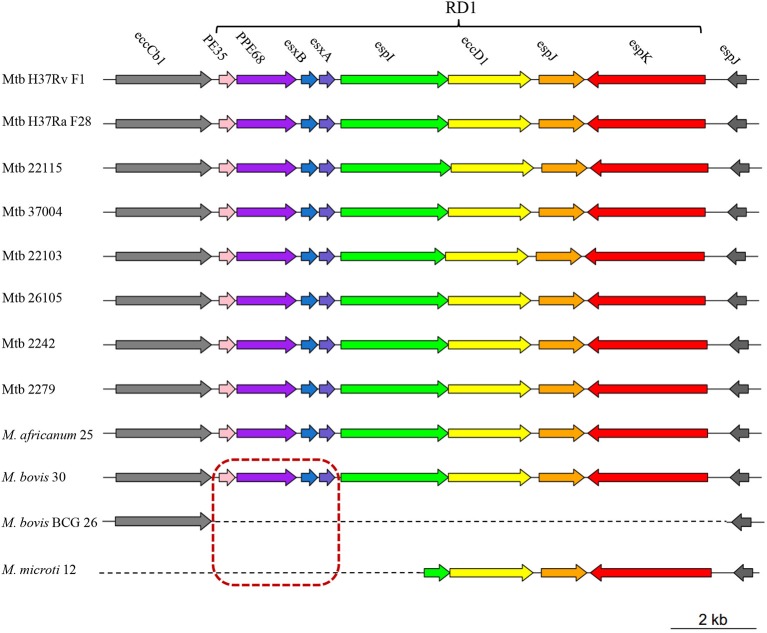
Figure 2.
A schematic diagram showing the RD1 distribution in 12 MTBC strains. Different colors represent different genes on RD1 (PE35, pink; PPE68, purple; esxB, blue; esxA, slate blue; espI, green; eccD1, yellow; espJ, orange; espK, red). Genes in the red dashed box indicate the four lost genes in the attenuated M. bovis BCG 26 and M. microti 12 strains. Genes upstream (eccCb1) and downstream (espJ) of RD1 are shown in gray.

