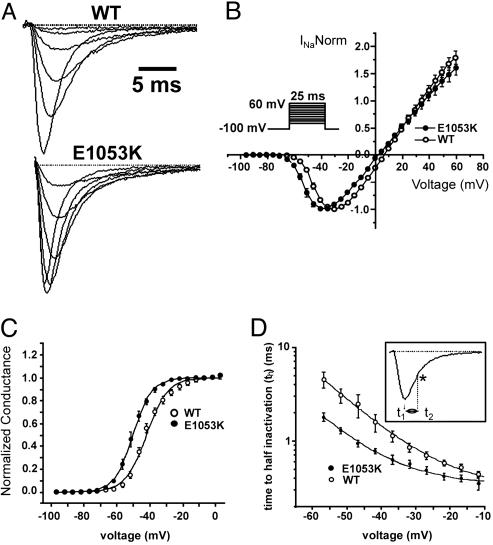
Fig. 4.
WT Nav1.5 and Nav1.5 E1053K voltage dependence of activation and kinetics of inactivation. (A) Averaged and normalized current traces recorded from WT (n = 33) and E1053K mutant channel (n = 18) obtained by applying depolarizing steps (–45 mV, –40 mV, –35 mV, –20 mV, –15 mV) for 25 ms. (B) Normalized current–voltage relationship for WT and E1053K recorded in 10 mM Na+ (n = 5 for WT, n = 5 for E1053K). The protocol is shown in the Inset. (C) Steady-state activation curve obtained by normalizing the peak current for the conductance over a range of voltages from –100 mV to 15 mV (n = 5 for WT and n = 5 for E1053K). Data are fitted with a Boltzmann function. (D) Kinetics of the onset of inactivation measured as time to half-inactivation. Given t1 as the time to the maximum peak and t2 as the time to 50% of current inactivation (*), th = (t2 – t1). See Inset for protocol.

