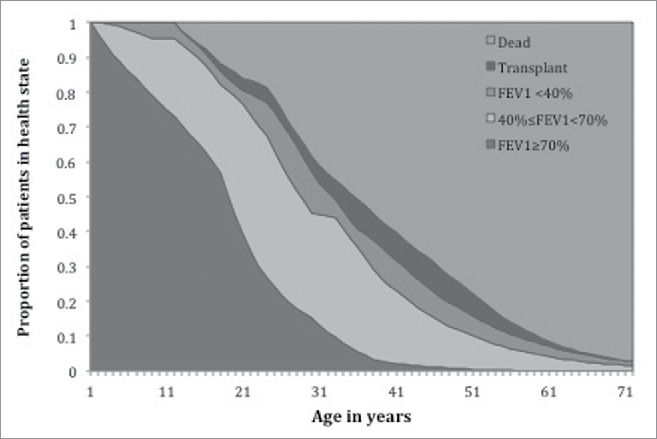
Figure 5.

Health state distributions over the lifetime of the natural history cohort of All CF patients in the model. (HS1= Mild Disease (FEV1 ≥ 70%), HS2 = Moderate Disease (40%≤FEV1 < 70%), HS3 = Severe Disease 3 (FEV1 < 40%), HS4 = Heart and/or Lung Transplant).
