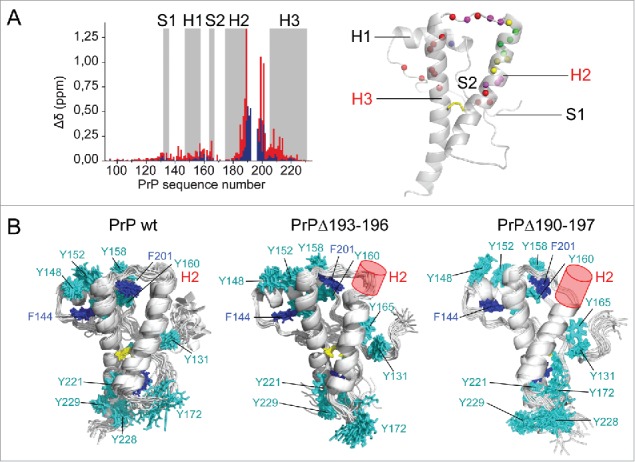
FIGURE 2.

Structural analysis of deletion mutants. (A) Perturbation analysis was performed by measuring amide1H,15N chemical shift deviations (Δδ) for PrPΔ193–196 (blue) and PrPΔ190–197 (red). The results are mapped on the PrP structure (in cartoon). Colored spheres represent amide nitrogen atoms with Δδ > 0.1 ppm in blue and red for each mutant, in magenta if deviations are observed in both. Yellow and green spheres indicate deleted residues in the mutants. (B) NMR structure ensembles of wild-type PrP and deletion mutants are shown in cartoon, without the disordered N-terminus. The disulfide bond (yellow), Phe (blue) and Tyr (cyan) side chains are represented in sticks. Deletions are indicated with a red cylinder.
