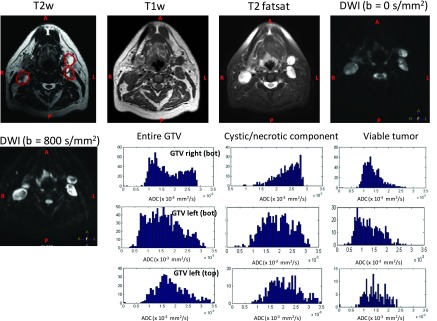
FIG. 2.
GTV nodal volume shown on T2w, T1w, T2 fatsat, DWI (b = 0 and 800) of a representative patient with 4 nodal volumes (pat 6). The histograms represent the ADC distribution for the entire tumor (left), the cystic/necrotic component of the tumor (middle), the viable tumor (right) for right (GTV 8), and left GTV nodal volumes (bottom or GTV 9 and top or GTV 10) for this representative patient.

