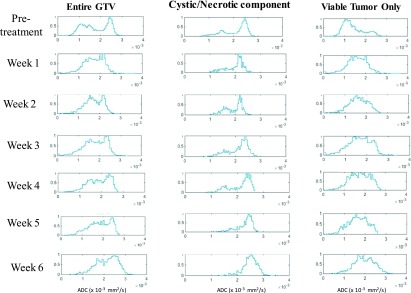
FIG. 3.
Weekly trend in histogram distribution of the entire tumor (left), the cystic/necrotic component of the tumor (middle), and the viable tumor (right) for a patient with large cystic/necrotic component (pat 10, GTV 15). The entire GTV represents a bimodal distribution which makes it difficult to evaluate the trend in weekly response assessment. Separating the tumor volume into viable tumor only and cystic/necrotic components gives a clear indication of true response assessment.

