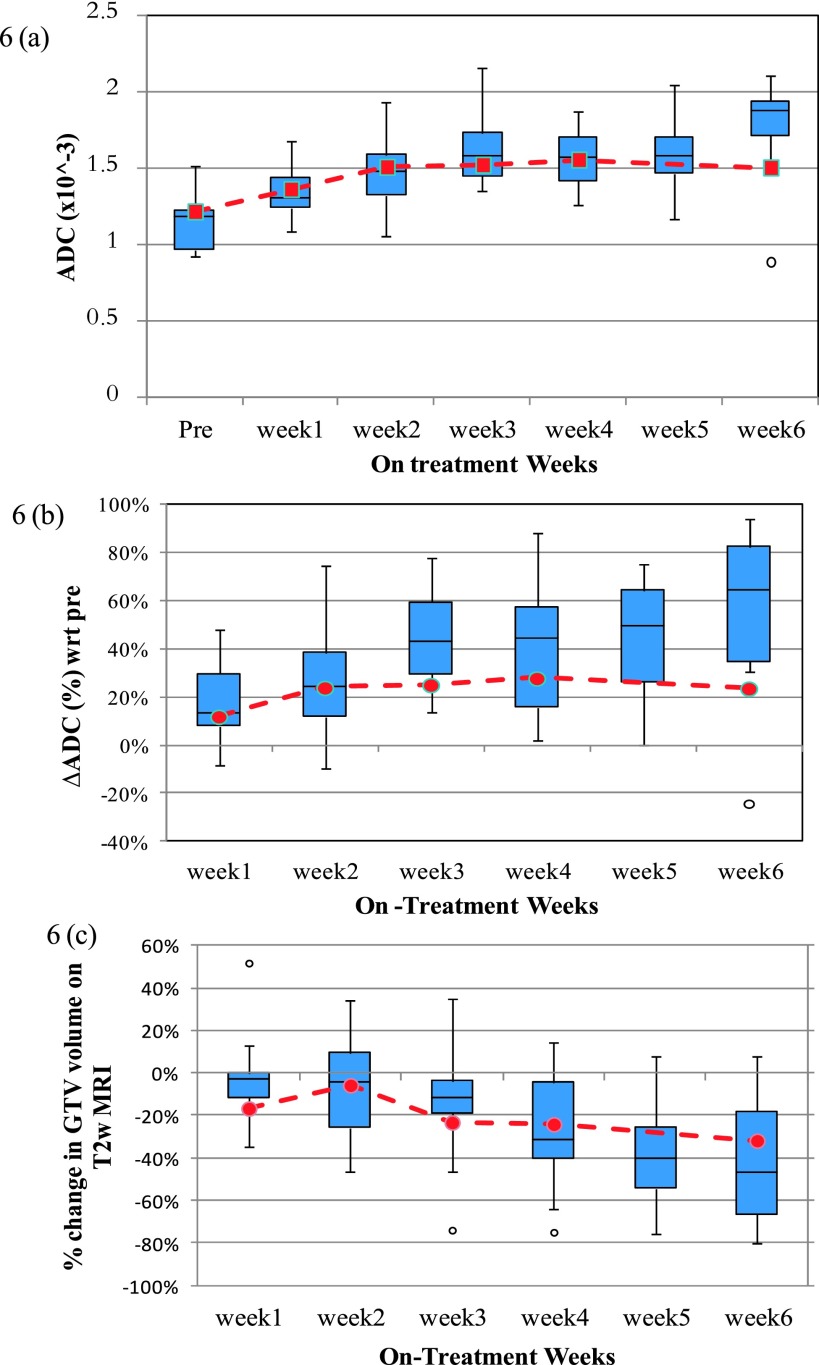
FIG. 6.
Population trend in (a) median ADC of the viable tumor, (b) percent change in median ADC of the viable tumor from the pretreatment value, and (c) percent change in T2w GTV with respect to the pretreatment volume on T2w MRI. The box plots represent the population trend for complete responders (total = 14 nodal volumes). The red dashed line represents the trend for a partial responder.

