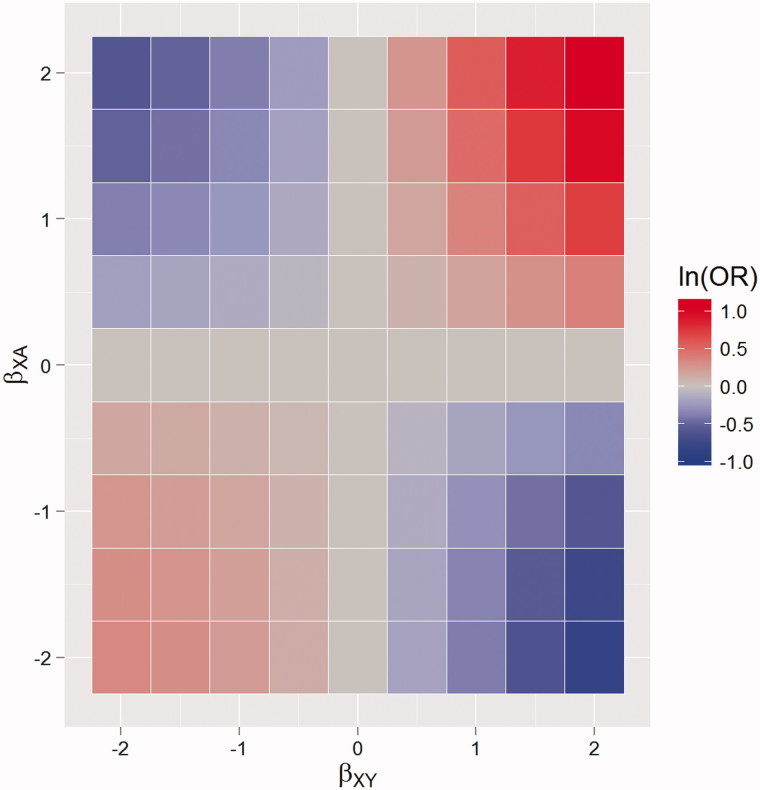
Figure 2.
Time-invariant confounding: heat maps of the bias of the estimated treatment effect, on the log odds ratio (ln(OR)) scale, when failing to control for confounding. With varying effect of a confounding variable on being in treatment (βXA) and outcome (βXY). The area in blue represents negative bias, the area in red positive bias.

