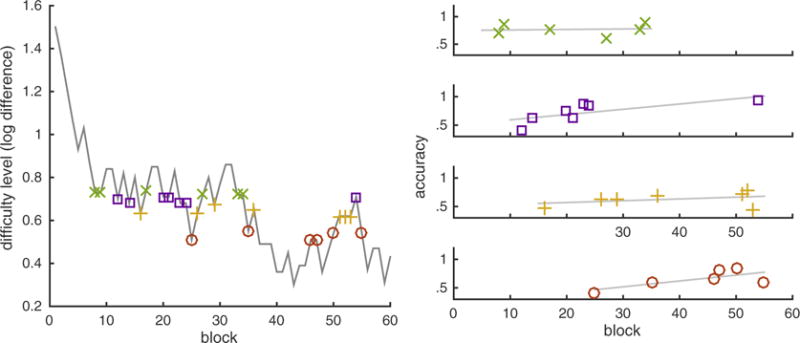
Fig. 1.

A graphical description of the empirical approach to test the training effects in an adaptive training paradigm. The left panel illustrates the progression of the difficulty level (log-difference) of the approximate arithmetic training in one representative participant. From this progression, we took samples of data where the difficulty ratios were identical or comparable across training blocks. Specifically, the log-difference levels were binned by deciles, and four decile bins (30–40th, 40–50th, 50–60th, 60–70th percentiles) were selected for further analysis. Each of the four bins is represented in different color. The graphs on the right panel illustrate the block accuracy of the approximate arithmetic task separated by the four bins, and the gray line represents the best linear fit. Using a linear mixed-effects model with block as a fixed-effects regressor and a random effect of bin, we tested whether or not accuracy increased as a function block. The logic is that if participants improved in solving the training task over the course of this adaptive training, then their accuracy for the identical/comparable difficulty level should increase over time. We found a positive linear slope across participants who performed approximate arithmetic training (t(17) = 1.965, p = 0.066 in match trials; t(17) = 2.219, p = 0.040 in compare trials), suggesting that participants’ performance improved over training. (For interpretation of the references to color in this figure legend, the reader is referred to the web version of this article.)
