
Figure 6.
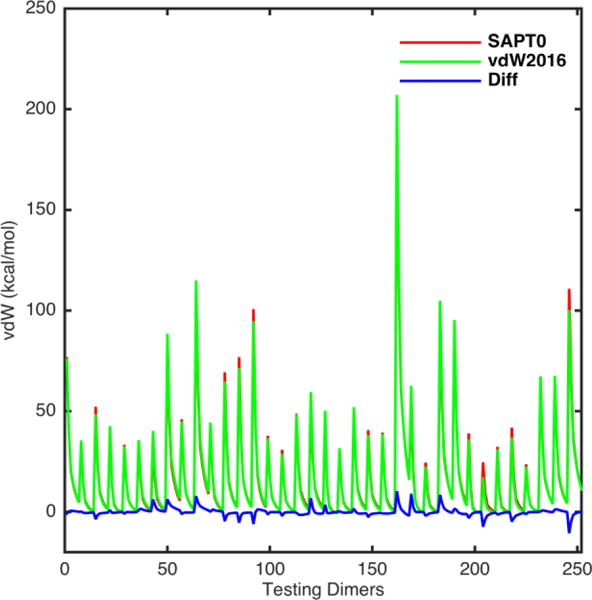
Plot of the vdW energy values of the testing set S36x7 calculated using the vdW2016 potential (green line) compared to the QM reference SAPT0/jun-cc-pVDZ (Red line). The blue line is the energy differences between the vdW2016 and SAPT0 results.