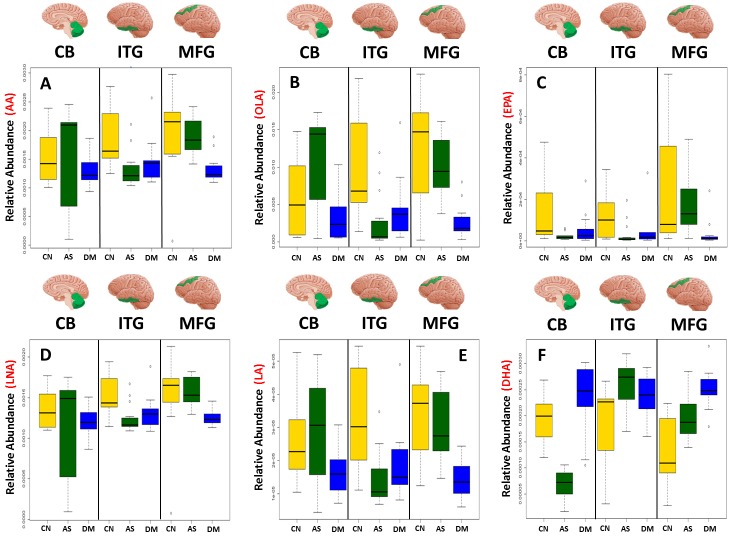
Fig 1. Boxplots showing the effect of disease status on the abundance of six UFAs in the CB, ITG, and MFG.
Dysregulation of six UFAs shown by boxplots of three disease statuses separated by brain region A) arachidonic acid (AA), B) oleic acid (OLA), C) eicosapentaenoic acid (EPA), D) linolenic acid (LNA), E) linoleic acid (LA), F) docosahexaenoic acid (DHA). AS, asymptomatic Alzheimer; CN, control; DM, Dementia/Alzheimer.

