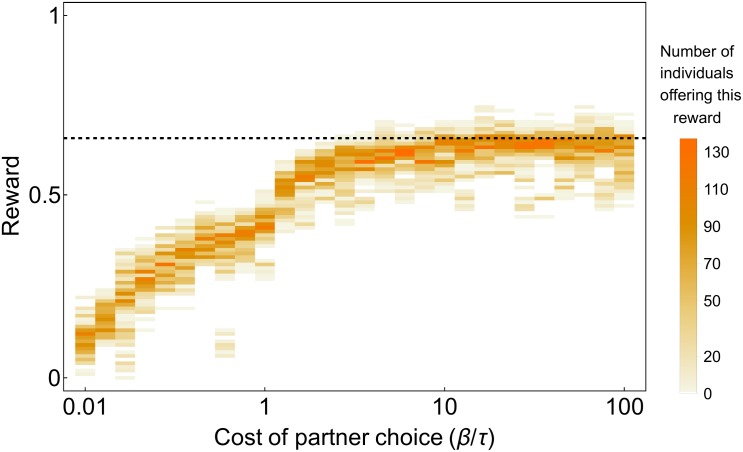
Fig 2. Distribution of rewards offered by low-productivity individuals to high-productivity individuals in the last generation of an 8,000-generation simulation, for different levels of partner choice cost (higher values of represent lower costs).
High-productivity individuals’ relative contribution compared to low-productivity individuals is 0.66, so the dashed line represents the expected equitable distribution. This distribution can only be reached when partner choice is not costly ( is high).

