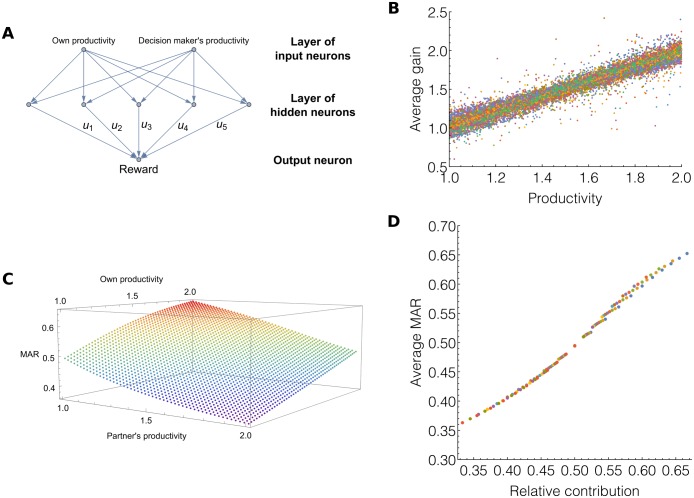
Fig 3. Evolution of equitable rewards made by neural networks working on a continuum of productivities.
A: Schematic representation of the neural networks that make rewards. Networks take each individual’s productivity as inputs and produce the reward as output. The u’s represent synaptic weights on which evolution takes place. B: 15,000 individuals and their lifelong average gain plotted against their productivity. C: Average MARs produced by the neural networks of 15,000 individuals after 8,000 generations, for different values of the input neurons. The more an individual produces and the less the partner produces, the larger the individual’s MAR. D: Average MARs produced by 15,000 neural networks plotted against the relative contribution of the bearer of the network.

