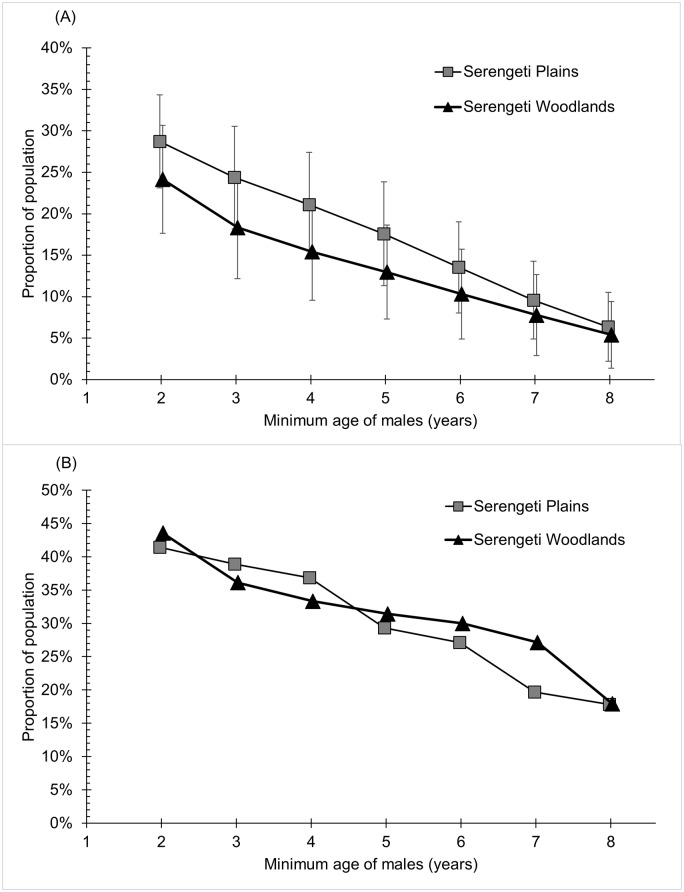
Fig 1. Number of males above each respective age divided by the total number of individuals of at least 1 yr of age in that population.
Proportions were calculated for each month from 1966 to 2014 (582 mos in the Serengeti woodlands, 515 mos in the Serengeti plains, see [22]). (A) Average monthly proportions, vertical bars indicate standard deviations. (B) Maximum monthly proportion observed across the entire study period.

